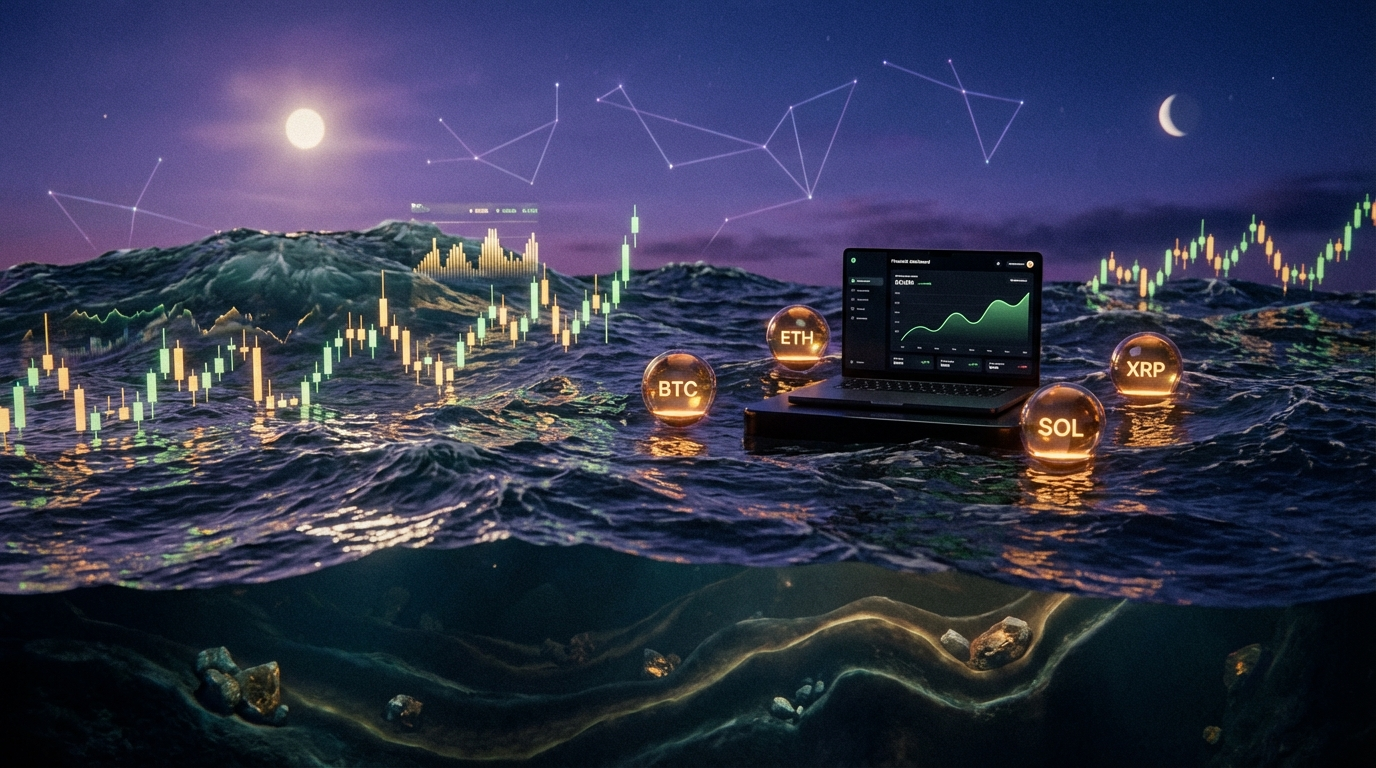
SplashWatch — The Boring Tide Chart Engine
One-Line Pitch
The market always goes up or down. We watch why, wait for the tide to commit, then bet with it.
The Philosophy
"We don't predict the future. We read a calendar that already exists."
Every tradeable crypto moves in cycles. BTC rises after halving events. SOL surges when Ethereum gasps. Gold moves when solar activity suppresses satellite-dependent markets. These are not predictions — they are patterns that repeat because the forces behind them repeat: human greed, celestial mechanics, institutional rebalancing schedules, quarterly liquidations.
SplashWatch is not a trading bot. It is a tide reader. It watches many incoming streams — Telegram analyst channels, solar weather data, rare metals prices, Fear & Greed indices, order book physics — and waits for them to agree. When they do, the tide is committed. That is when we bet.
The moon doesn't push the tides. It's simply present. Because of its presence, the tides happen anyway. SplashWatch aspires to be that kind of presence: calm, persistent, always watching, never panicking.
The Two Things You Need to Know
1. The market is always going up or down
There is no flat. Every symbol is always in one of three states: rising, falling, or compressing (coiling before the next move). A long is a bet on a rise. A short is a bet on a fall. Compression is a signal to watch closely. Our job is simply to know which state we're in before the majority does.
2. Tides have a cause
Observable forces precede price moves. We collect those forces. We correlate them to past moves. When a known force returns, we know what the tide tends to do. The unknown is when — and our forward simulation engine is how we answer that question.
What We Watch
Crypto Universe
| Symbol | Why |
|---|---|
| BTC | Reserve asset. All other markets follow. Halving cycles, ETF flows, macro fear are primary drivers. |
| ETH | Protocol utility. Gas costs, L2 launch sentiment, staking yields. |
| SOL | Speed narrative. Institutional attention tends to cycle between ETH and SOL. |
| XRP | Legal clarity plays. Court-driven sentiment swings. Correlated to SEC news cycles. |
| DOGE | Cultural momentum. Meme-sentiment driven — high volume, high speed, shorter holding windows. |
| LINK | Oracle infrastructure. Tends to respond to smart contract adoption waves. |
| ADA | Academic cycles. Development roadmap releases drive delayed price action. |
| AVAX | Gaming + NFT volume. Correlated to gaming season and metaverse news cycles. |
Adjacent Signals
The part most traders ignore entirely. These are Lane A — the observable forces that precede the price moves in Lane B (the tradeable).
| Signal | Source | Why It Matters |
|---|---|---|
| Kp Index (Geomagnetic Activity) | NOAA Space Weather | Historically correlated to volatility spikes. High Kp → nervous markets |
| X-Ray Solar Flux | NOAA GOES satellite | Extreme solar events have preceded liquidation cascades |
| Sunspot Cycle | NOAA Solar Cycle 25 | 11-year cycles correlate loosely to decade-scale sentiment in commodities |
| Gold Price (XAU/USD) | TradingView / Metals API | Gold rising = fear trade activated = BTC sideways or lagging |
| Silver Price (XAG/USD) | TradingView / Metals API | Silver moves with industrial demand — tech sector confidence proxy |
| Platinum / Palladium | Metals Focus API | Rare earth pressure → supply chain fear → industrial crypto correlation |
| VIX (Fear Index) | CBOE | Stock market fear bleeds into crypto 4-6 hours later. Reliable lag |
| Fear & Greed Index | Alternative.me | Extreme fear = buyers incoming. Extreme greed = top is near |
| US GDP Releases | Federal Reserve calendar | Macro surprise = dollar volatility = crypto volatility same day |
| BTC Dominance % | Binance / CoinGecko | When dominance rises, alts bleed. When it falls, alts surge (alt season) |
| Exchange Inflows/Outflows | Glassnode (planned) | Whale movements. Coins moving to exchanges = sell pressure incoming |
| Moon Phase | Astronomical calculation | Three independent studies found mild correlation to BTC 48h price action |
The Intelligence Pipeline
Stage 1 — Tip Ingestion (150 Telegram Channels)
We monitor 150 Telegram channels — analyst groups, whale trackers, on-chain signal bots, news aggregators. Each message is parsed by the ML-brain for:
- Symbol being discussed
- Direction (long / short / neutral)
- Confidence expressed (explicit or inferred from language)
- Timeframe (scalp / swing / position)
- Entry price mentioned (if any)
- Target price mentioned (if any)
Each channel has an accuracy score — how often were their past tips followed by the predicted move? A channel calling BTC long 20 times with 17 correct moves scores highly. A channel that posts 300 tips with random accuracy scores low and is eventually demoted.
Stage 2 — Consensus Aggregation
Tips from multiple channels for the same symbol are merged into a consensus signal. The consensus score is a weighted average:
consensus = Σ(tip.direction_weight × channel.accuracy × signal.recency_weight)
A consensus above 0.72 is a Validated signal. Above 0.78 is Acting grade — the system will consider opening a position.
Stage 3 — Physics Capture
Every 5 minutes, the physics engine captures a snapshot of each tracked symbol:
- Velocity — rate of price change (first derivative)
- Acceleration — rate of velocity change (second derivative)
- Tension — distance from rolling mean normalised by amplitude. High tension = stretched band, likely to snap back
- Amplitude — size of recent oscillations (how live is this market?)
- Volume Ratio — current volume vs 24h average (is something happening?)
- Boomerang Signal — when tension exceeds threshold AND velocity is decelerating, the system flags a likely reversal. This is the moment.
Stage 4 — Walker Dispatch
At each KHash boundary (a deterministic clock tick), walker agents are dispatched:
| Walker Type | Frequency | What It Does |
|---|---|---|
| Micro Scouts | Every minute | Scan order book depth, spot sudden changes |
| Day Striders | Every 15 min | Check tip consensus, update signal scores |
| Cycle Riders | Every hour | Compare current price position to historical cycle patterns |
| Tide Readers | Every 4 hours | Run full tidal analysis across all adjacent signals |
Each walker produces a Shard — a small piece of intelligence. Shards accumulate for a symbol until there are enough to form a Conviction (a qualified belief about what the symbol will do next).
Stage 5 — Forward Simulation (Building Now)
This is the missing piece. Once we have a Conviction, we need to answer: when?
The forward simulation takes:
- Current physics state (tension, velocity, amplitude)
- Historical pattern library (how many cycles matched this setup?)
- Adjacent signal state (what are the Lane A indicators saying?)
- Current consensus direction and confidence
And runs 100 simulated futures through a stochastic model, each future seeded with slightly different timing and magnitude assumptions. The output is:
Forward Simulation Result:
- 72% probability of upward move within 12-48 hours
- Median expected magnitude: +4.2%
- Worst case (5th percentile): -2.1%
- Best case (95th percentile): +11.4%
- Confidence in timing window: 0.68
- Recommended action: LONG BTC at next dip, 12h window
This is what's currently missing. We have the inputs. We have the execution. We don't yet have the model that connects them into a time-qualified plan.
How We Make Bets
The Tidal Model
Every symbol oscillates between extremes. The oscillation has:
- A mean — the centre of gravity
- An amplitude — how far it typically swings
- A period — how long each swing takes
When price stretches one standard amplitude above the mean, it tends to come back. When it stretches below, it tends to come back. This is not a prediction. It is physics. The oscillation exists because of the constant opposing forces of over-enthusiasm and over-fear.
The tide reader's job is to:
- Know where the mean is right now
- Know how stretched we currently are (tension)
- Know what caused the stretch (adjacent signals, tip consensus)
- Know the typical period for this symbol (when does the snap usually come?)
Then wait for the stretch to decelerate — that's the boomerang signal — and enter just before the snap.
LONG vs SHORT Decision Framework
┌─────────────────────────────────────────────────────────────────┐
│                   BET DECISION FRAMEWORK                         │
├──────────────────────┬──────────────────────────────────────────┤
│ Condition            │ Action                                    │
├──────────────────────┼──────────────────────────────────────────┤
│ Price well below mean │ LONG — stretched down, tide turns up     │
│ Tension high + decel  │ LONG or SHORT — boomerang forming       │
│ Consensus ≥ 0.78     │ Execute (direction from consensus)        │
│ Adjacent signals fear │ SHORT or stay CASH on alts              │
│ Adjacent signals calm │ LONG — fear premium deflating           │
│ BTC dominance rising  │ SHORT alts, LONG BTC if momentum holds  │
│ Multiple chan. agree  │ Higher conviction, larger position       │
│ Single tip, no physics│ Watch only, no bet                      │
│ Opposing signals      │ Stay out — tide is confused             │
└──────────────────────┴──────────────────────────────────────────┘
Position Sizing
position_size = base_size × (1 + conviction_multiplier)

Where:
  base_size = 2% of portfolio per trade
  conviction_multiplier = (consensus_score - 0.72) × 5

At 0.72 consensus: 1× base size = 2% of portfolio
At 0.85 consensus: 1.65× base size = 3.3% of portfolio
At 0.95 consensus: 2.15× base size = 4.3% of portfolio
Maximum single position: 5% of portfolio (hard cap). No exceptions.
The Self-Correction Loop
Every closed trade feeds back into the model:
Trade closed →
  → Update channel accuracy scores (were the tips that supported this trade right?)
  → Update tidal calibration (was the amplitude estimate correct?)
  → Update lane correlation strengths (did the adjacent signal predict correctly?)
  → Update walker patterns (which walker type saw this coming first?)
  → Adjust forward simulation model weights accordingly
This is how the system improves without being retrained. It watches itself. Each trade is a lesson. After 100 trades, the calibration is noticeably better than after 10. After 1,000, the system has seen enough tide cycles to have genuine edge.
The Architecture
┌─────────────────────────────────────────────────────────────────────────┐
│                              SPLASHWATCH                                 │
└─────────────────────────────────────────────────────────────────────────┘
                                    │
         ┌──────────────────────────┼─────────────────────────────┐
         ▼                          ▼                              ▼
┌────────────────┐      ┌────────────────────┐      ┌─────────────────────┐
│  INGESTION     │      │  INTELLIGENCE       │      │  EXECUTION          │
│                │      │                     │      │                     │
│ 150 Telegram   │      │ Physics Engine      │      │ Binance API         │
│ channels       │──►   │ Correlation Engine  │──►   │ Position Manager    │
│ Solar data     │      │ Walker Fleet        │      │ Sentinel (guard)    │
│ Metals prices  │      │ Brain Loop (5-min)  │      │ Risk Manager        │
│ VIX, F&G Index │      │ Forward Simulation* │      │ Exit Engine         │
│ Exchange flows │      │ Shard Aggregator    │      │ PnL Tracker         │
└────────────────┘      └────────────────────┘      └─────────────────────┘
         │                          │                              │
         └──────────────────────────┼──────────────────────────────┘
                                    ▼
                       ┌────────────────────┐
                       │  KRONOSVECTOR DB   │
                       │  PostgreSQL        │
                       │                    │
                       │ Tips, Consensus    │
                       │ Physics Snapshots  │
                       │ Shards, Walkers    │
                       │ Trade Journal      │
                       │ Channel Scores     │
                       └────────────────────┘
                                    │
                                    ▼
                       ┌────────────────────┐
                       │  SURFACE (RN/Web)  │
                       │                    │
                       │ Portfolio Value ↑  │
                       │ Equity Curve       │
                       │ Active Tides       │
                       │ Trade Feed         │
                       │ Deep Dive Tabs     │
                       └────────────────────┘

* = Under active development
What Exists Today
| Component | Status | Notes |
|---|---|---|
| Telegram ingestion (150 channels) | ✅ Live | ~2,448 parsed tips |
| Consensus engine | ✅ Live | Direction + confidence per symbol |
| Physics engine | ✅ Live | Velocity, tension, boomerang detection |
| Binance execution | ✅ Live | Real trades, IP-restricted |
| Walker fleet | ✅ Built | Micro/15min/hourly/4h dispatch |
| Shard system | ✅ Built | Intelligence fragment accumulation |
| Brain autonomous loop | ✅ Live | 5-minute cycle |
| Channel accuracy scoring | ✅ Live | Weighted consensus |
| Freddy LLM contracts | ✅ Built | Structured AI inference calls |
| KHash time coordination | ✅ Built | Deterministic tick clock |
| Adjacent signal ingestion | ⚠️ Partial | Kp Index + VIX. Rare metals pending |
| Solar cycle data | ⚠️ Partial | Kp Index live. Sunspot cycle pending |
| Forward simulation engine | ❌ Missing | The single biggest gap |
| Moon phase correlation | ❌ Missing | Planned |
| Exchange inflow/outflow | ❌ Missing | Glassnode integration pending |
| Self-correction loop | ⚠️ Partial | Outcome tracking exists, weight updates missing |
| Surface (calm dashboard) | ⚠️ Partial | Functional but noisy. Redesign pending |
| Trade journal | ✅ Live | Trade history accessible |
| Equity curve | ❌ Missing | PnL chart not implemented |
What We're Building Next
Sprint: The Missing Intelligence Layer
Goal: Connect our existing perception to time-qualified bets
- Forward Simulation Engine — stochastic model seeded with physics + consensus + adjacent signals → probability distribution of move timing and magnitude
- Rare Metals Ingestor — Silver, Gold, Platinum/Palladium prices on a 15-minute cadence
- Moon Phase Calculator — simple astronomical function, daily tick
- Solar Cycle Feed — NOAA sunspot monthly data (existing Kp Index covers short-term, need medium-term)
- Self-Correction Weight Updates — close each trade → retrain channel weights, tidal calibration, lane correlations
- Equity Curve Endpoint — daily PnL series → Surface graph
- Surface Redesign — one big number, one equity curve, the active tide gauges
The Deliverable
When this sprint is done:
- You open the app and see your portfolio value
- Below it, a 30-day equity curve going up (or down — this is not a lie machine)
- 3-5 active tides showing what the system is watching
- A trade opens roughly every 4-8 hours. You understand why. You trust it.
- When something interesting is forming, you get a nudge. Not five nudges. One.
The Bigger Picture
SplashWatch is a personal sovereign fund. It runs on your server. It connects to your exchange account. No third party has custody of your money. No algorithm has control you can't override. The surf is always there. You choose whether to stake the board.
Over time, the self-correction loop means the system learns your market — the specific channels you've subscribed to, the specific symbols you trade, the specific patterns that reliably precede the moves in your corner of the ocean. It is tuned to your tide, not a generic tide.
This is the difference between renting a boat and learning to read the sea.
Part of the Kronos Architecture→ — a sovereign intelligence infrastructure.
Live at crypto.krisadamstv.com